100% Pass Cisco, PMP, CISA, CISM, AWS Dumps on SALE!
Get Now
01:59:56
X
6 free network delay testing tools
As a network administrator or network engineer, it is important to always pay attention to the speed of network delivery. Not only do you need to ensure that you have a good response time, but you also need to ensure that the speed of the network is sufficient for every path that users need to communicate. And manually testing each path will take up all your time. Therefore, you need to obtain a test tool to ensure that the delay does not affect the performance of the network.
What is delay?
Latency is an indicator of the speed of network traffic. The acceptable transmission time varies depending on the application used. Video playback and interactive VoIP calls need to be faster than email transmission. Therefore, you need to calculate the speed required for network traffic based on the services you provide to users.
Measurement delay
The delay is in ms. However, there are two indicators that indicate delay. Whether you choose to test on the Internet, try to keep all records in the same test category.
The most common delay measurement is called "round trip time" (RTT). As the name suggests, this is the time it takes for a packet to travel from one point on the network to another. Another measure is called "Time to First Byte" (TTFB). This records the time difference between the moment when the first part of the packet leaves a point on the network and the time it reaches its destination. RTT is used more frequently than TTFB because it can be run from one location and does not require special data collection software to be installed on the remote target.
Use Ping
Every computer connected to the network has a free delay test tool built into the operating system called Ping. This tool is suitable for the IP layer protocol, namely the Internet Control Message Protocol (ICMP). Every network administrator uses Ping, which is a useful tool for quick inspection. You don't need to install any software on the remote computer, and you can return the report to the computer that started the command.
A typical Ping execution will send 32 bytes of data to a given target and record the time it takes for the response to return. The delay is expressed as the round trip time, which includes the transmission time of the test packet and the response packet. The time is displayed in milliseconds.
If you want to test RTT to the website, you do not need to know the target IP address, because Ping will accept the domain name as the address instead of the actual IP address. By default, Ping will send four test packets, but an option on this command allows you to specify a different number of tests.
The results of the Ping command display the RTT of each test, and then summarize the results. You will see the number of packets sent, the number of responses received, and the number of lost packets. You will also see the lost packet count expressed as a percentage of all tests. The second summary line shows the minimum, maximum and average round-trip time of the test batch.
Ping problem
When a specific path runs slowly, Ping is very suitable for quick inspection. However, this tool will not help you fix the delay problem, and it does not allow you to check multiple paths with one command. Fortunately, there are many more complex Ping-based tools available. These usually enable you to test multiple paths from the same console. You can also often use some tools to run Ping tests. These constant Ping tools can display the results of delayed tests in real time.
Delay solution
Latency is a complex issue that can be managed by traffic shaping methods, such as queuing algorithms. A series of "quality of service" (QoS) methods can be used to prioritize certain traffic. This allows you to get time-sensitive application traffic through all network devices before all other traffic. If you provide real-time video transmission of IP phone applications on the Internet, this is great.
Clearing some traffic through switches and routers in the network may cause other traffic types to be blocked. However, if you can save you have to replace the network cable to provide enough bandwidth for all traffic to pass through as quickly as possible, then a delay of a few minutes in email transfer is worth the price.
▐ Today I will recommend six free network delay testing tools.
Network Pinger
Network Pinger is a free tool that runs on Windows. This simple utility has a beautiful interface, and the display panel is mainly occupied by the scan results. The output is a recursive ping. It will test all target IP addresses in the range you entered as search parameters. The side panel displays a graphical representation of the data collected by the scan. These include contact status pie charts and line charts showing response time. You can also see the RTT (round trip time) for each contact attempt.
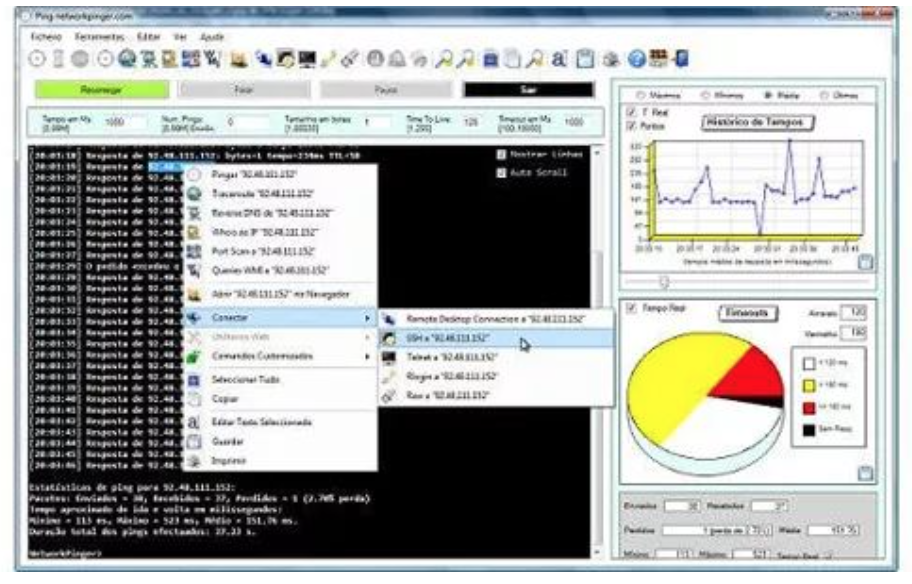
In addition to the Ping function, Network Pinger also includes a Traceroute tool, which can provide you with the response time of each hop in the link to the target address. The tool also has a switch port mapper. You can use the built-in remote desktop, SSH, Telnet and Rlogin utilities to contact remote computers through this tool.
ManageEngine
ManageEngine is a Ping and Traceroute tool. The free software package also includes DNS lookup functions and professional measures of website response time.
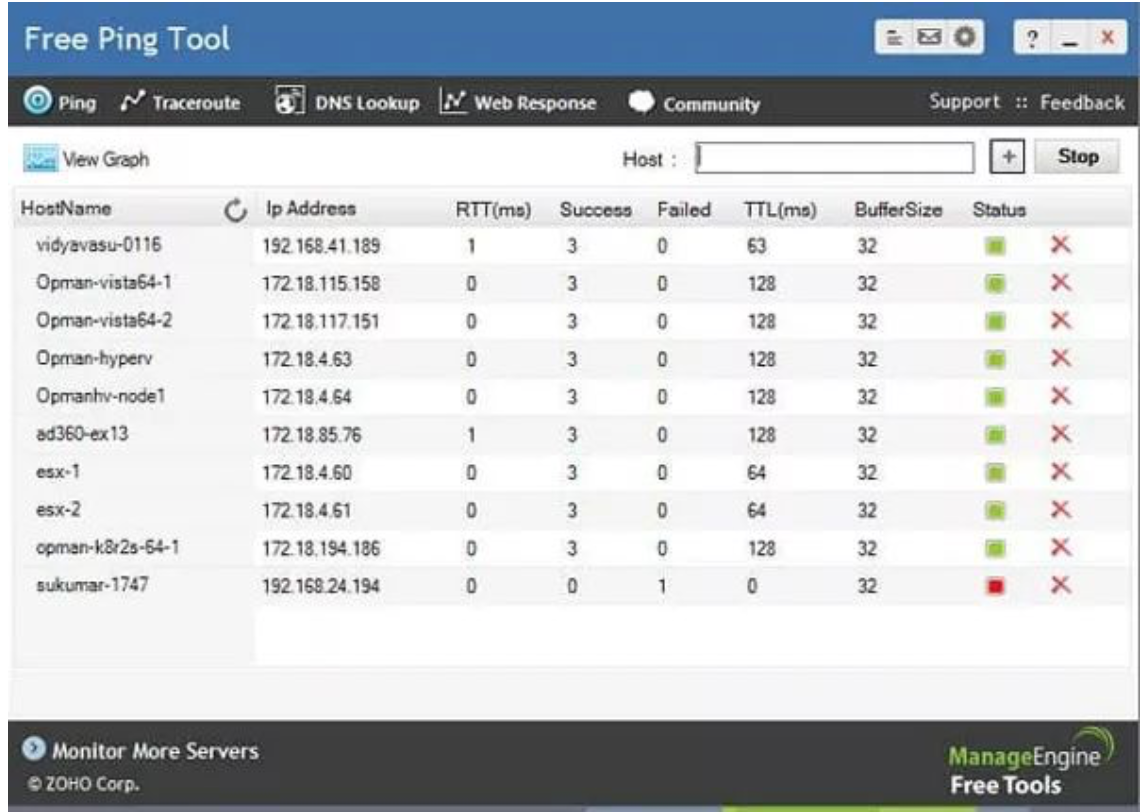
The Ping section of this tool displays the Ping data for each given host and each host, including round trip time. The screen will continue to refresh, providing you with real-time RTT updates to your IP address list.
One problem with this tool is that you must enter each address individually, not the address range. However, once you enter these contents on the screen, they will remain there even if you have to stop the display to switch to other utilities. Ping results can also be displayed on a time series line chart.
The Traceroute utility displays the round-trip time of each hop of the route to a given destination and displays a bar next to it, which makes RTT easy to understand.
If the URL you entered does not have a local record, the DNS lookup utility will refer to your local network DNS server or the nearest Internet-based server. You can enter an IP address or URL as a search term for this utility.
The Web Response tab provides you with an accurate graph of the Web server response time for a given website address. This chart will continue to be updated and it will show the RTT breakdown between TCP session establishment, redirection time and webpage response time.
This is a great little tool, you can also print the report in PDF format, you can save or send an email.
NirSoft NetworkLatencyView
NirSoft's NetworkLatencyView tool is slightly different from all other latency testing tools on this list. The utility does not check the links of the specified target, but listens for all new TCP connections and monitors when they are persistently stored. The tool's report is based on Ping, so you will get the same delayed feedback as other tools.
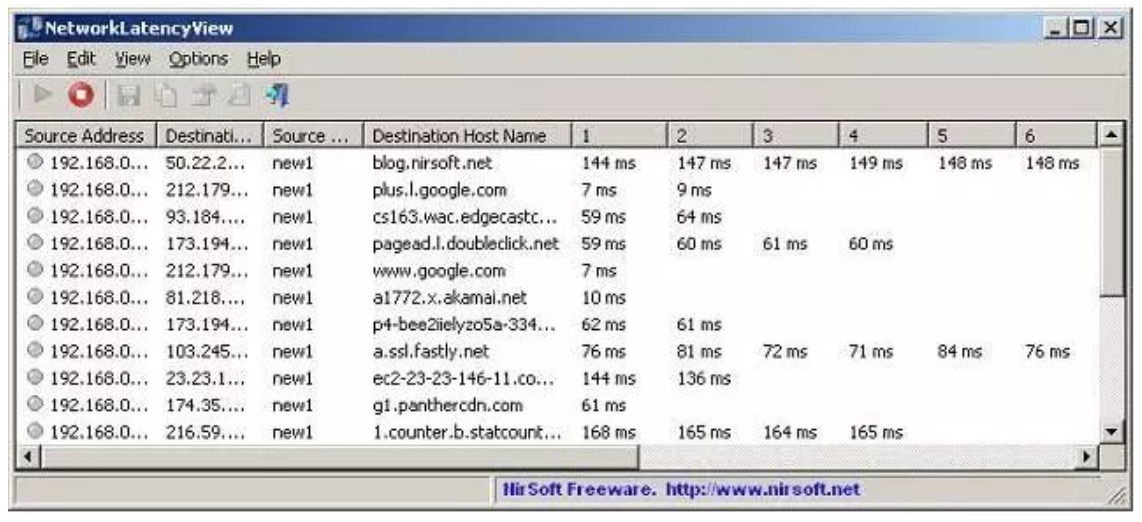
This is a free tool that is installed on Windows. For each detected connection, the display window can display up to 10 Ping test RTT values. It also shows the average of these ten tests. However, you can resize the column, stretch the window or scroll to the right to view all the data. The results can be saved as CSV, HTML, XML or text files for analysis in other applications.
Angry IP Scanner
Angry IP scanner is a free Ping utility that runs on Windows, Linux and Mac OS. The simple layout of the interface makes it a useful tool for network administrators. You can start the Ping scan by entering the "from" and "to" IP addresses or entering the host name and CIDR notation offset. You can also enter a non-contiguous list of IP addresses by loading from a file into the interface.
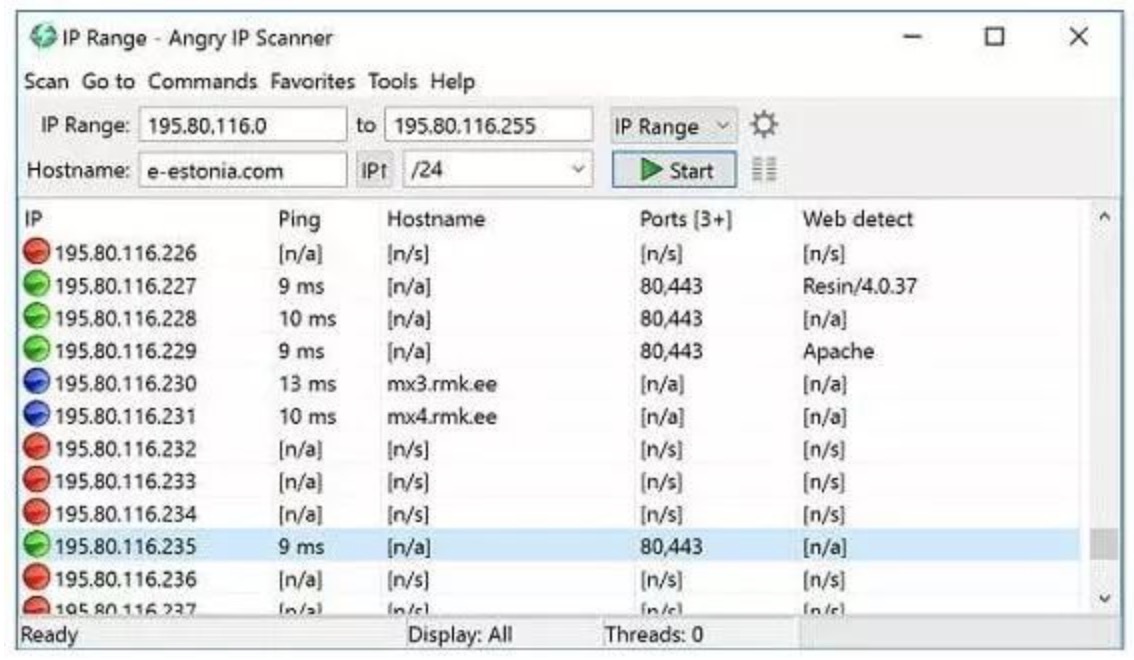
The tool will ping each address in the given range and display each address in the output. This may cause a large number of unused addresses to appear on the screen. You can avoid this large number of unrelated records by setting to display only real-time IP addresses in the "Preferences" section of the tool. This requirement can be further refined by an option that restricts the output list to show only hosts with open ports.
You can use classic ICMP messages, TCP or UDP for testing. Although the utility will ping many hosts in one run, it will only run each ping probe on demand. The service will not repeat continuously. If you want to refresh the report, you need to press the "Start" button again.
The default output only displays the average RTT of each discovered IP address, as well as the host name of the target and the number of open ports on the device. You can customize the output by selecting additional data categories. These include packet loss fields.
The number of tests issued is determined by a setting in the "Preferences" screen. The default number of probes for each address is 3. Test output can be exported in CSV, XML, text or IP port format.
Pinkie
Pinkie is a set of network monitoring tools, including Ping scanning options. The tool can be used free of charge and runs on Windows.
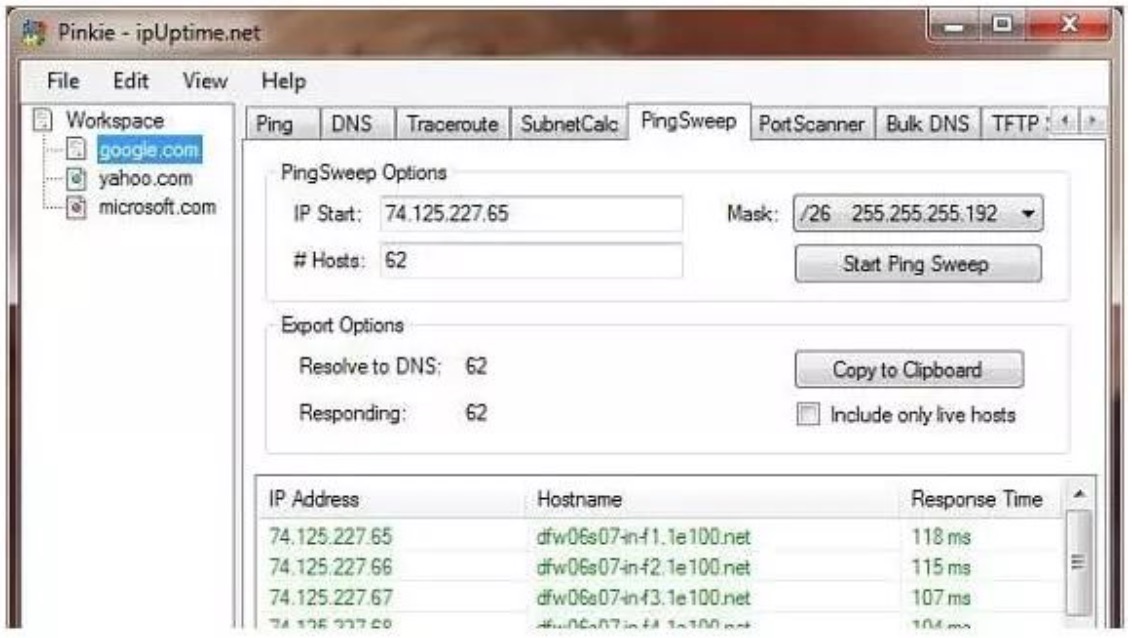
The tool also includes a simple Ping option, which can only detect a target IP address, and can also be entered as a URL. This function will continue to send Ping packets to the target, displaying the RTT and the "time to live" setting entered in each probe packet.
The Ping Sweep option will test a series of addresses.
However, the test is not continuous and the utility must be launched again by pressing the "Start Ping Scan" button to refresh the results. You can exclude inactive IP addresses by checking the check boxes in the search section of the screen. The results in this screen show the IP address, host name and RTT of the probe. You can copy the Ping Sweep output to the clipboard and then paste it into a text file.
Other utilities in Pinkie are port scanners, Traceroute implementation, DNS lookup functions, and bulk DNS reference tools, which use the list of addresses in the file. The subnet calculator and TFTP server are also included in the bundle. This is a very useful set of tools to help you keep all the tools you need to check the network in one interface.
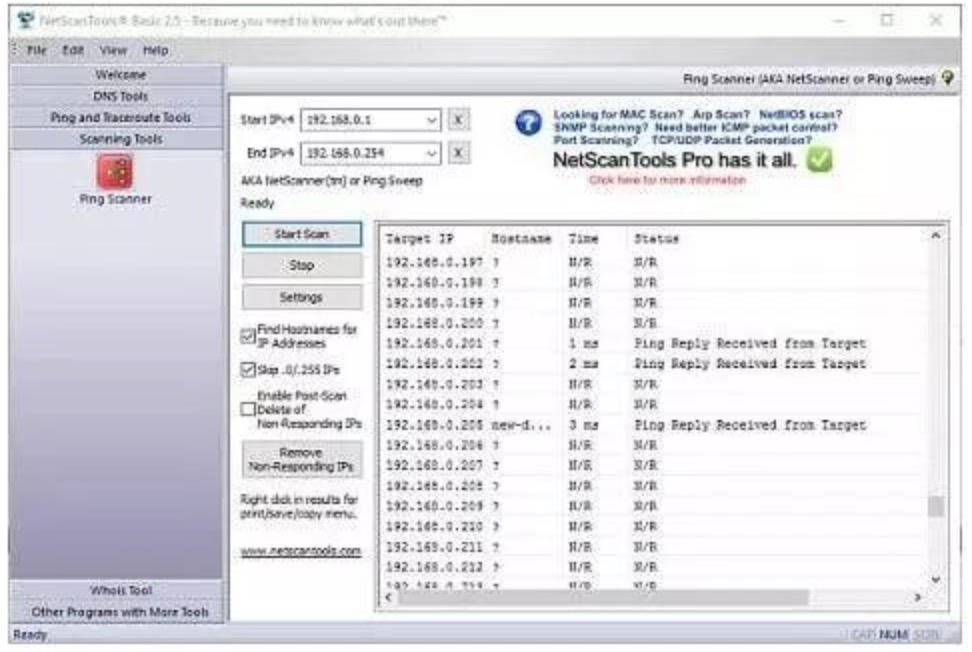
NetScan Tools
NetScan Tools Basic Edition is a set of free network testing tools that run on Windows. The tool is free, but there are pop-up ads. If you want to get rid of these ads, you can buy NetScan Tools Pro.
Three Ping-based utilities are available in both versions of NetScan Tools. The package also includes the Traceroute tool, so you have four ways to test network latency.
The first Ping option is a direct graphical interpretation of standard commands. Enter the domain name, host name or IP address, and the tool will send five ping probes to the target. The output will show the RTT and time to live for each probe. You can change the number of packets sent in each run in the "Settings" menu.
The graphical Ping option shows the continuous execution of Ping tests on a single target. Similarly, the target can be specified by host name, domain name or IP address. The test will be repeated until you choose to stop. Even after you leave, you can continue when trying different utilities. The graph shows the RTT for each attempt.
Ping scanner allows you to test a series of IP addresses. The output will show the results of the Ping test to each address in the given range. However, you can choose to delete non-responsive addresses. The results include IP address, host name, round trip time, and status report for each address in the range. Click the right mouse button to use the context menu. This allows you to print the output of the test or save it to a file.
The Traceroute tool provides you with another view of network latency. This shows every hop between the computer and a given target address. The RTT of each hop is displayed along with the IP and address of each intermediate router. This command will be run once. If you want to get the speed update for each link in the connection, you must reissue the command.
Other tools in the package are DNS lookup function and Whois query tool.
The above is the news sharing from the PASSHOT. I hope it can be inspired you. If you think today' s content is not too bad, you are welcome to share it with other friends. There are more latest Linux dumps, CCNA 200-301 dumps, CCNP Written dumps and CCIE Written dumps waiting for you.
Related Dumps


Cisco Dumps Popular Search:
ccna resume pdf ccna certification plus a training badge examen 8 cisco ccna 2 ine ccie dc topology ccnax exam ccna exam code 2015 ccna 200-301 official cert cisco ccna certifications ccna 200-125 free dumps 2018 cisco 400-151 dumps
User Links
Latest Dumps

Copyright © 2026 PASSHOT All rights reserved.